Avoiding the wall – Bat Style!
HERO-1 has 3 separate components for “vision”:
- Light level sensor
- Motion Detector
- Sonar Distance Detector
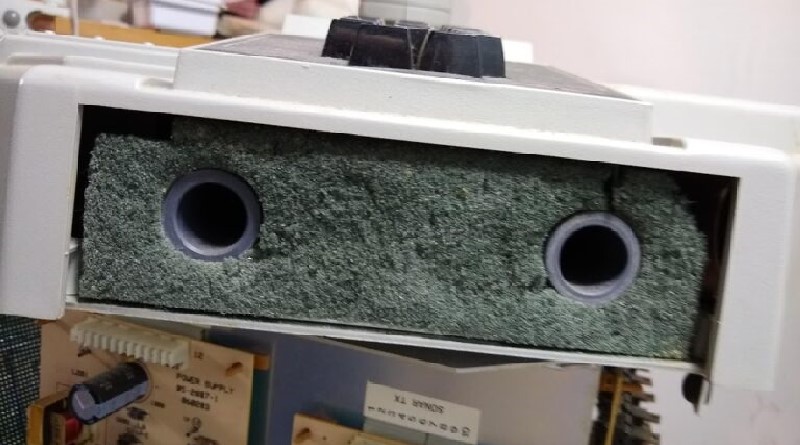
This entry is about the sonar distance component. There are 2 tube structures – a Transmit tube and a receiver tube. The sonar is emitted by the transmitter, and the resulting echo is received by… you guessed it… the receiving tube.

For a robot, these make the perfect forward-facing component, as when you put the TX and RX tubes next to one another to make them work, you end up with an ideal pair of robot eyes! In this case, the foam around them has obviously seen some better days, and as part of this project, I plan on replacing it at some point. It’s important to me to find something as close to the original color as possible and/or paint something when the time comes. I’ll cross that bridge when I come to it.
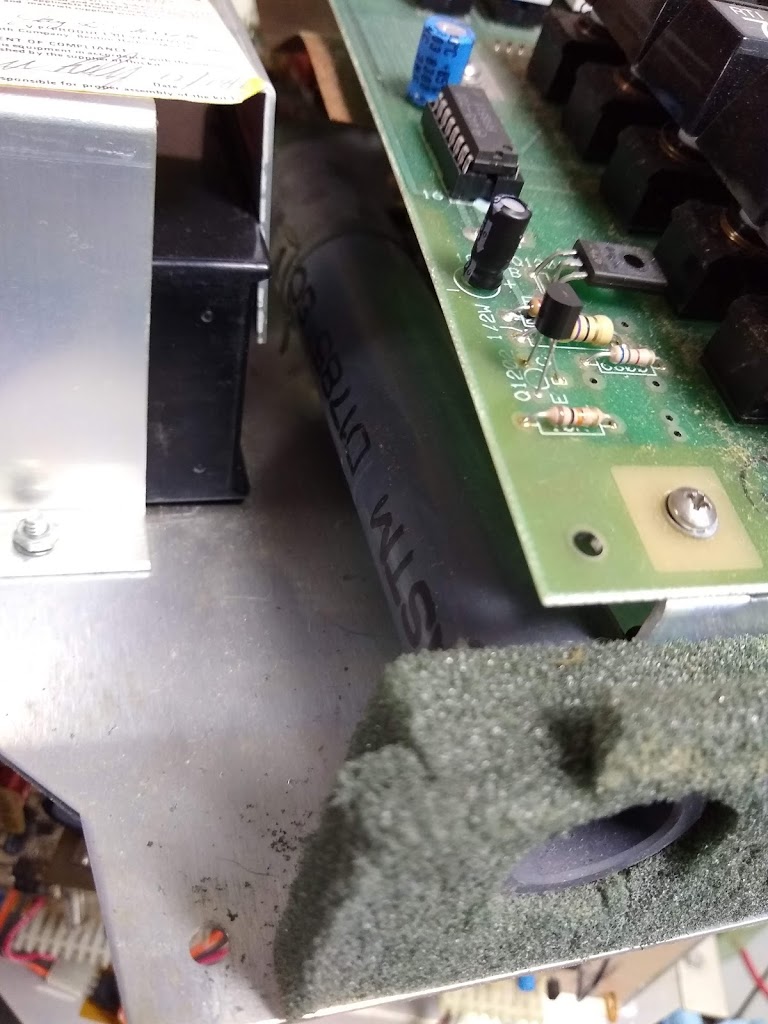
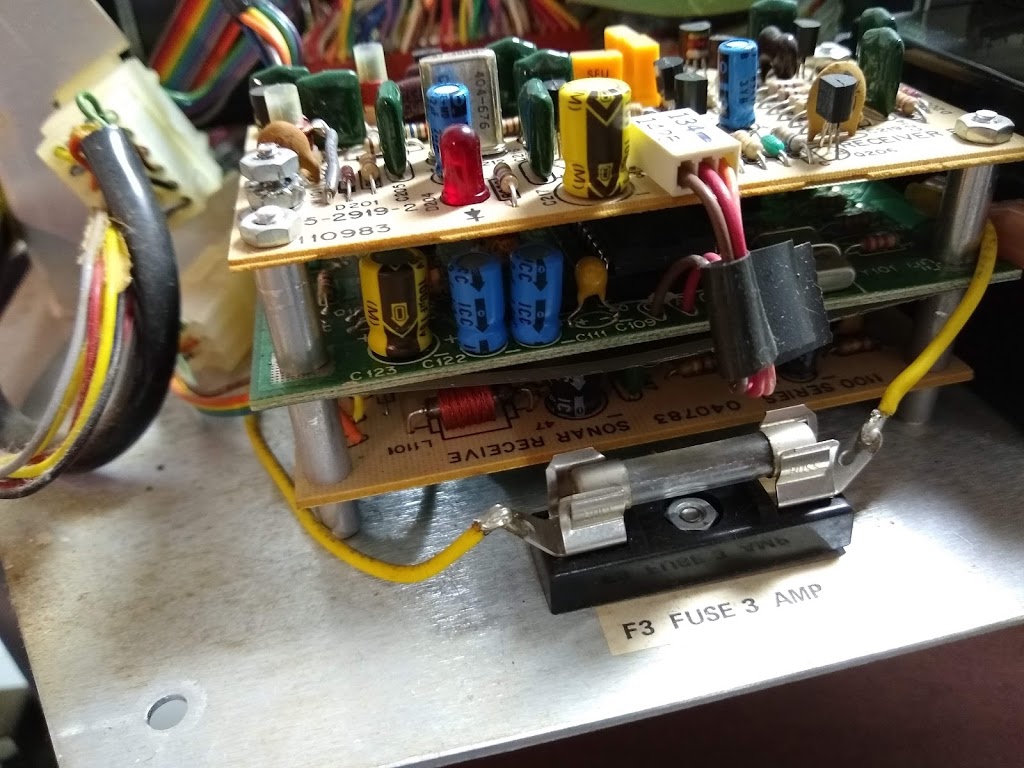
Each tube has a separate and corresponding circuit board to power and controls its functionality. The TX board is part of his core body, while the RX board lives in the back of his head (both pictured below).

When power is supplied to Sonar via Hero’s IO “spine,” the TX board begins transmitting an ultrasonic signal at a frequency set by the adjustable pot on the TX board. IOW, this is a hardware constant, and the I/O to/from the boards only does 3 things:
- gives power to the sonar subsystem
- raises the voltage on a pin during the transmit
- raises the voltage on a pin during the receive
This actually makes this one of the more straightforward boards to program as it comes down to hooking an interrupt up to the transmit and receive pins, and then counting the elapsed time between the pics going high.
The challenge then becomes what does this interval represent? How do we turn the random numbers returned into actionable data? The first thing that comes to mind is to figure out what kind of decay rate we have on our signal as the distance increases. To do this, I took a bunch of readings at different distances and graphed them.
| Millis | Inches |
|---|---|
| 2300 | 2 |
| 2580 | 10 |
| 2740 | 11 |
| 3400 | 15 |
| 4900 | 24 |
| 7000 | 38.5 |
| 10000 | 56 |
I took readings multiple times, and each time came up with the same graph, which contains a distinct inflection point at x = 10. While I suppose this could be some strange and undocumented attribute of physics, the much more likely explanation is simply that the hardware can’t measure the time delay very accurately within this range. While there might be some nice formula that can turn this graph into a single formula, I’ve opted to divide it into 2 line formulas split at the inflection point of 10.
The average slope of the first line is 35, so the formula of the first is:
y = x/35 – 63.71
This formula is good for 0 <= x <= 2580
The average slope of the second line is 160, so the formula of the second line is:
y = x/160 – 6.125
This formula is suitable for x > 2580
That’s a good robot !!